Most small business owners in India track revenue, costs, and customer metrics obsessively. But HR metrics? Those usually live in someone’s head — or worse, in a spreadsheet nobody updates.
That’s a problem, because people are your largest operating cost. And what you don’t measure, you can’t improve.
The good news: you don’t need 50 metrics. You need the right 12. This guide walks you through the HR KPIs that matter most for small businesses in India, how to calculate each one, and what benchmarks to aim for in 2026.
Why HR Metrics Matter for Small Businesses
Large enterprises have entire analytics teams. But for a 50-person company, even a 5% improvement in employee retention, a 2-day reduction in time-to-hire, or a 10% drop in absenteeism can have a direct and measurable impact on revenue.
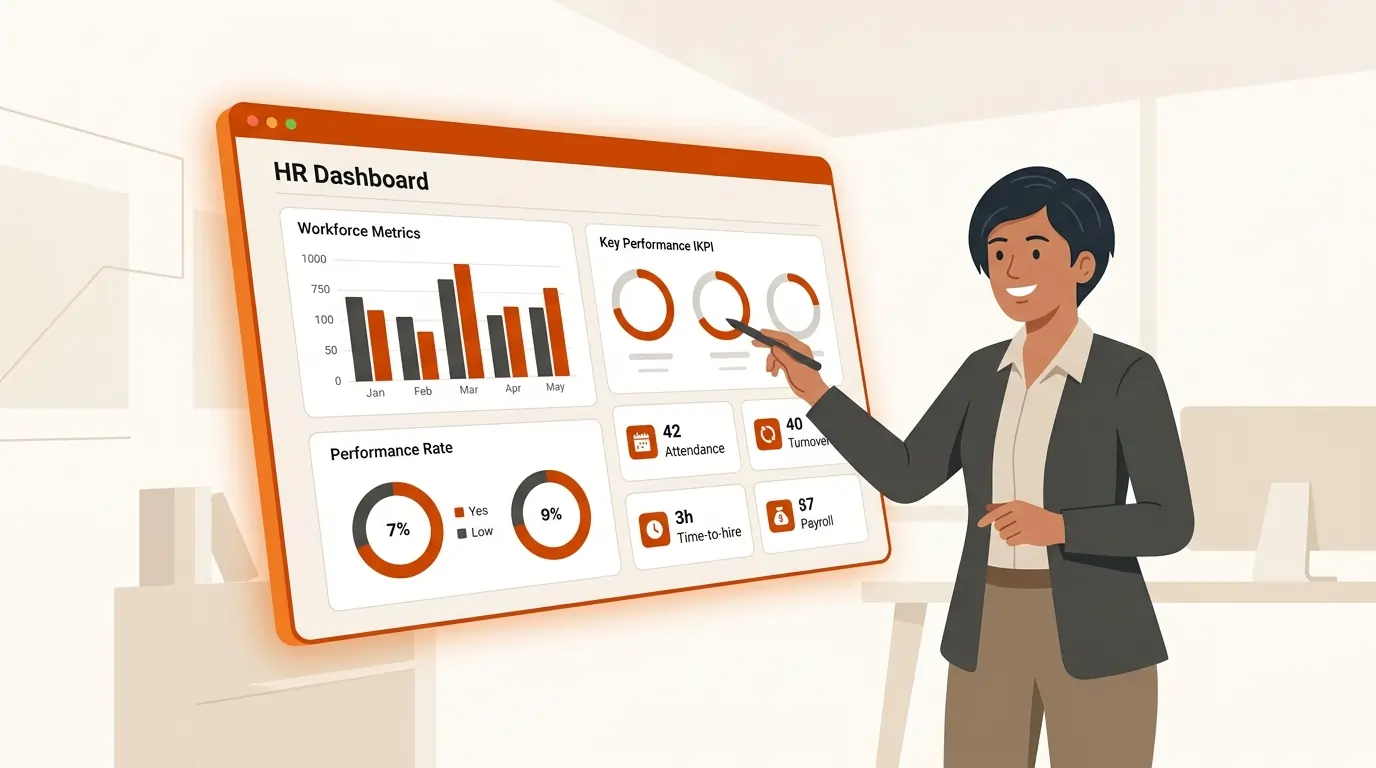
The challenge is that tracking these metrics manually is time-consuming enough that most small businesses don’t do it consistently. That’s exactly the problem that a modern HRMS like PulseHRM solves — it makes these KPIs visible automatically, through live dashboards, without any manual data extraction.
Category 1: Workforce & Retention Metrics
1. Employee Turnover Rate
Formula: (Employees who left in period / Average headcount) x 100
Why it matters: High turnover is expensive. Replacing an employee in India costs an estimated 50–200% of their annual salary when you factor in recruitment, onboarding, and lost productivity. The national average attrition rate across industries in India is around 20–25%. If yours is higher, something systemic needs to change.
Benchmark: Aim for under 15% annually in most industries. Under 10% for high-retention roles.
2. Voluntary vs. Involuntary Turnover
This split matters. High voluntary turnover suggests a culture, compensation, or management problem. High involuntary turnover points to hiring quality issues. Tracking both gives you a more actionable signal.
3. Employee Retention Rate
Formula: ((Employees at end of period – New hires) / Employees at start) x 100
The inverse of turnover, but worth tracking separately — especially for key roles. Losing one senior developer or operations manager is very different from losing three junior executives.
Category 2: Recruitment & Hiring Metrics
4. Time to Hire
Formula: Average number of days from job posting to offer acceptance
India’s fast-moving talent market means slow hiring costs you candidates. The average time-to-hire in India is 28–35 days. If yours is consistently over 45 days, your process needs acceleration.
PulseHRM’s ATS tracks every stage of the recruitment funnel — application, screening, interview, offer — so you can identify exactly where candidates are getting stuck.
5. Cost Per Hire
Formula: (Total recruitment costs in period / Number of hires)
Include agency fees, job board costs, interview time, and onboarding costs. This KPI helps justify investment in internal HR tools — if an HRMS reduces your cost-per-hire from ₹45,000 to ₹28,000, the ROI is clear.
6. Offer Acceptance Rate
Formula: (Offers accepted / Offers extended) x 100
If this is below 80%, your compensation benchmarking may be off, your employer brand needs work, or your hiring process is creating the wrong impression of the company. Benchmark: 80–90% for healthy hiring pipelines.
Category 3: Attendance & Productivity Metrics
7. Absenteeism Rate
Formula: (Days absent / Total scheduled workdays) x 100
India’s average absenteeism rate is around 8–10% for manufacturing, 4–6% for services. A rate above your industry average often signals disengagement, burnout, or systemic team culture issues.
PulseHRM tracks attendance across biometric, GPS, and mobile check-ins — giving you real-time absenteeism data without chasing timesheets.
8. Overtime Hours
Consistent overtime is a leading indicator of either understaffing or poor workload distribution. Track which teams are logging the most overtime — and investigate before it becomes a burnout crisis.
9. Leave Utilisation Rate
Formula: (Leave days taken / Leave days available) x 100
Very low utilisation (below 60%) can indicate a culture where employees feel they cannot take leave — which predicts burnout and attrition. This KPI is easy to pull from PulseHRM’s leave management module.
Category 4: Performance & Development Metrics
10. Performance Appraisal Completion Rate
Formula: (Appraisals completed / Appraisals scheduled) x 100
If appraisals aren’t happening on time, performance management isn’t happening at all. Target 95%+ completion. PulseHRM automates reminders and workflows to keep this rate high.
11. Training Completion Rate
Formula: (Employees who completed training / Employees enrolled) x 100
Especially relevant for compliance-mandated training (POSH, safety, etc.). Tracking this protects you from legal risk and signals your investment in people development.
Category 5: HR Efficiency Metrics
12. HR-to-Employee Ratio
This measures how many employees each HR team member is supporting. Indian SMBs average 1:50 to 1:80. If your ratio is 1:120+ without HRMS software, your HR team is overloaded — and errors are inevitable.
Investing in HRMS software effectively expands your HR team’s capacity without adding headcount. PulseHRM customers regularly handle 1:150+ ratios efficiently because automation handles the repetitive work.
How to Start Tracking These KPIs
The biggest barrier for small businesses isn’t knowing which KPIs to track — it’s having a system that surfaces them automatically.
Here’s a simple 3-step approach:
- Step 1: Audit what you’re currently tracking (even if it’s ‘nothing’) and identify your top 3 pain points from the list above.
- Step 2: Implement an HRMS that captures the underlying data — attendance, leaves, appraisals, payroll — in a centralised system.
- Step 3: Set quarterly targets for each KPI and review them in leadership meetings, not just HR meetings. People metrics are business metrics.
The Bottom Line
HR KPIs aren’t about bureaucracy. They’re about running a tighter, more people-centric business. When you know your turnover rate, your time-to-hire, and your absenteeism trend, you can make decisions before problems become crises.
PulseHRM’s built-in dashboard makes all 12 of these KPIs visible in real time — no spreadsheets, no manual reports. Try PulseHRM and see the difference data-driven HR makes.